GrowthDataProduct
Engineering a High-Efficiency Acquisition Engine
- Organisation
- iLyF · Easy, Instant Insurances
- Role
- Owned acquisition end to end: channel structure, store listing, instrumentation and the renewal loop
- Period
- Malaysia
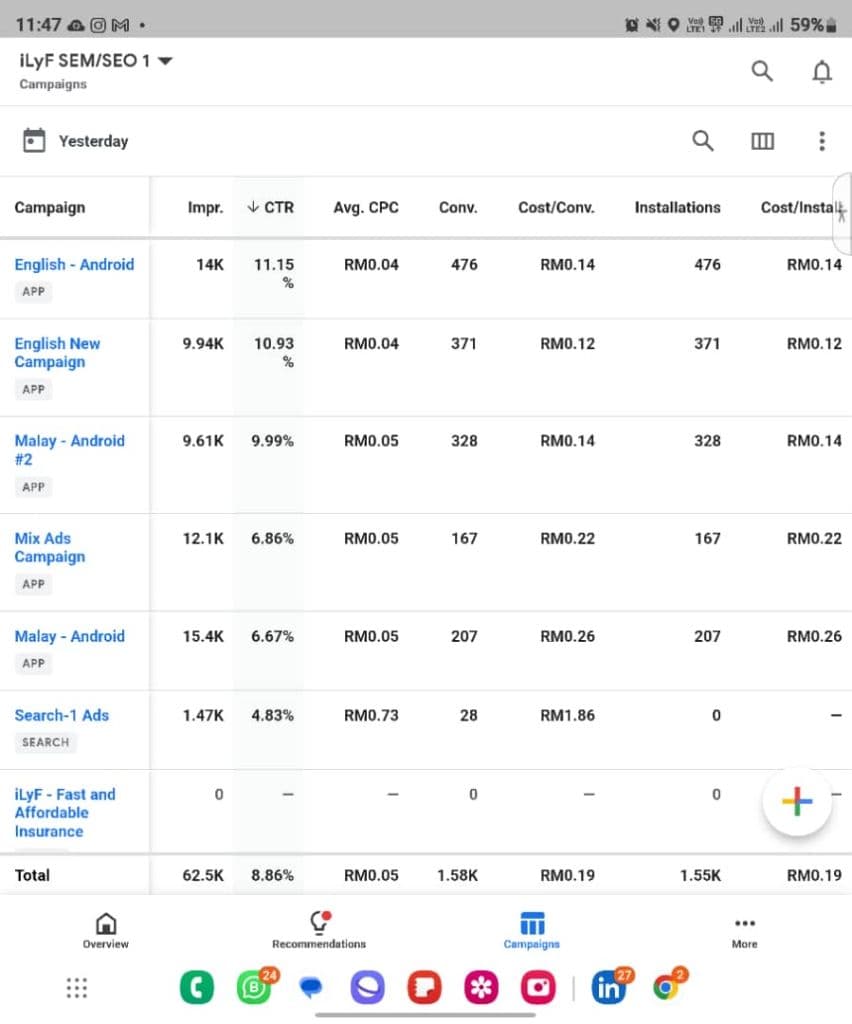
Installs between twenty sen and two ringgit depending on the month, a store listing that climbed from invisible to the top of the Malaysian insurance category, and acquisition cost recovered in about three weeks. The figures below are the working dashboards, read the way I read them at the time, including the single best day, which is labelled as such rather than passed off as the average.
- cost per install, monthly actuals across the measured period
- RM0.20–1.92cost per install, monthly actuals across the measured period
- blended cost per install on the single day the dashboard below shows
- RM0.19blended cost per install on the single day the dashboard below shows
- monthly click-through rate, against a 6.66% cross-industry average
- 3.9–9.8%monthly click-through rate, against a 6.66% cross-industry average
- of ad clicks became installs, monthly
- 15.7–21.3%of ad clicks became installs, monthly
- LTV to CAC in Q4 2024, against a 3:1 healthy benchmark
- 4.4–4.9LTV to CAC in Q4 2024, against a 3:1 healthy benchmark
- to recover customer acquisition cost
- 0.6 monthsto recover customer acquisition cost
- return on ad spend, Q3 to Q4 2024, with net crossing 1.0 in Q4
- 1.21 → 1.65return on ad spend, Q3 to Q4 2024, with net crossing 1.0 in Q4
- category visibility against every insurer app in the market
- Near-zero → top 2category visibility against every insurer app in the market
The dashboards, and what I read off them
Context
- Motor insurance is bought once a year by people who do not think about it in between.
- There is no habit to build on and no daily usage to grow, so every customer starts as an install somebody paid for.
- The ceiling on what that install can be worth is fixed: one premium, once a year, at a margin the insurer sets.
- That ceiling is the entire problem to solve.
What was actually needed
- Two numbers, not a campaign.
- A cost per install low enough that a first-year customer paid for themselves.
- A second year that cost close to nothing to win.
- Everything I did to the channels was in service of those two, and anything that moved a metric without moving one of them got cut.
What the campaign table told me
- The search campaign was buying clicks at RM0.73 against RM0.04 to RM0.05 on the app campaigns, converting at RM1.86, and producing zero installs. It was paying premium rates for intent the store listing was already capturing for free.
- The blended “Mix Ads” campaign came in at RM0.22, worse than every dedicated campaign it was blended from, because mixed targeting averages you into your most expensive audience instead of letting the cheap one run.
- The two Malay campaigns landed at RM0.14 and RM0.26. Same language, same product, nearly double the cost, which said the variance was creative rather than audience.
- Running the whole table back: 62.5K impressions at 8.86% is roughly 5,500 clicks, which produced 1.55K installs. That is a store listing converting a bit over a quarter of everyone it saw that day, and it is the real reason cost per install was twenty sen rather than eighty.
- Sustained across whole months the conversion ran lower, between 15.7% and 21.3%. The day below is the ceiling, not the baseline.
What I did with that
- Killed search entirely and moved the budget into app campaigns.
- Split every blended campaign into single-audience ones, so a cheap segment could not subsidise an expensive one inside a single average.
- Ran each language twice with deliberately different creative, because the RM0.14 against RM0.26 gap said creative variance was worth more than another audience test.
- Treated the store listing, meaning title, screenshots, description, ratings and replying to reviews, as a paid channel with its own budget of attention. Roughly a quarter of the cost per install was set there rather than in the ad.
What the visibility curve told me
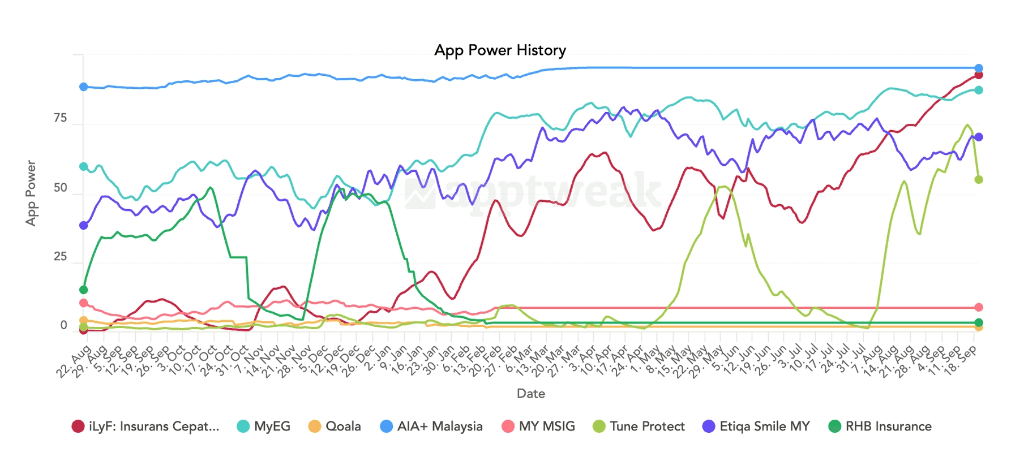
- AIA+ holds a flat line near the top for the whole period. That is brand spend, and it is not a game a startup wins.
- RHB spikes to the middle of the chart and collapses back to zero inside two months, and Tune Protect does the same thing twice. Those are burst campaigns, and the collapse is what a burst always does.
- Our line does neither. It sits near zero for months, then climbs steadily for eight of them, past MyEG, past Etiqa Smile, into second place behind an incumbent insurer.
- A slope like that cannot be bought in a burst. It is the compounding return on listing quality and review responses, and it is the cheapest visibility in the category because nobody else was willing to wait for it.
Why the two charts are one story
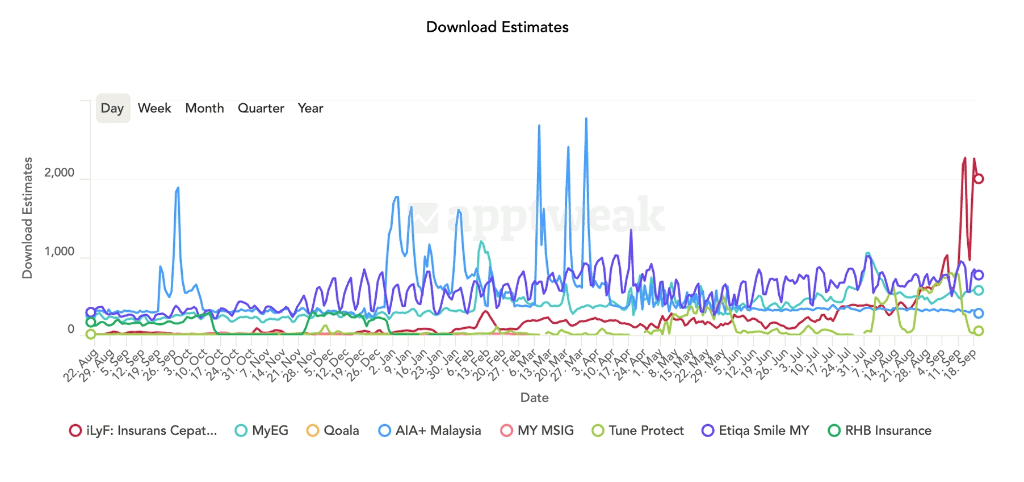
- Put the download chart next to the visibility chart and the mechanism is visible.
- Early on, our downloads are pure spikes with a floor at zero. Everything we got, we bought, and the day the campaign stopped so did the installs.
- By the end of the window the floor between spikes has lifted well clear of zero, and the spikes themselves reach the top of the chart.
- Same campaigns, taller peaks, because paid traffic now landed on a listing that ranked and converted.
- Paid efficiency was not won in the ad account. It was won on the store page, and the ad account is where it showed up.
Decisions that mattered
- Optimising bidding toward policies bought rather than installs. Install is the cheap, fast, satisfying number and it is the wrong one, because it rewards whichever audience is most willing to download something free.
- Once the campaigns were fed conversions further down the funnel, the cheap-install audiences dropped out on their own.
- Refusing to judge a channel before renewal data existed for it. In a once-a-year product a cohort is not readable for twelve months, and every premature verdict we made in the first year was wrong.
What changed
- Across the measured months, cost per install ran between RM0.20 and RM1.92. The twenty-sen days were real, but they were the good days rather than the average one.
- Installations reached the low hundreds of thousands over thirty months, with several months inside the Google Play Store’s top 10 Lifestyle apps.
- Return on ad spend moved from roughly 0.5 to 1.21 by Q3 2024 and 1.65 by Q4, and net return crossed 1.0 in that final quarter, the point at which acquisition stopped being funded and started paying for itself.
- The honest attribution is the renewal automation rather than anything in the ad account, because a second year won at almost no cost is what finally made the first year’s spend affordable.
The insight I kept
- Cost per install is a vanity number until you divide it by the people who actually buy something.
- The most useful hour I spent on this was not in the ads manager. It was working out that a quarter of my paid efficiency was being set by a store page I had been treating as marketing collateral rather than as the top of the funnel.
Stack & practices
- Google Ads app campaigns
- ASO and store listing
- AppTweak
- Mixpanel
- Cohort and ROAS dashboards
- Lifecycle automation